Production Monitoring with New Relic APM: A Step-by-Step Guide
Production Monitoring with New Relic APM: A Step-by-Step Guide
If your app is slowing down in production and you have no idea why, you’re not alone. Most engineering teams spend way too much time digging through logs and guessing instead of actually fixing problems. That’s exactly where New Relic APM changes the game.
This guide is for developers, DevOps engineers, and engineering leads who want real visibility into how their applications behave in production — not just when something breaks, but all the time.
Here’s what we’ll walk through together:
- Setting up New Relic APM from scratch so your app starts sending data right away
- Navigating the APM dashboard so you know exactly where to look when performance dips
- Configuring New Relic alerts so your team catches issues before users ever notice them
By the end, you’ll have a working monitoring setup, a cleaner production workflow, and a much better handle on how to improve application performance over time. Let’s get into it.
Understanding New Relic APM and Its Core Benefits

What New Relic APM Does for Your Production Environment
New Relic APM gives you real-time visibility into your app’s health, tracking transactions, errors, and dependencies automatically.
Key Features That Make Real-Time Monitoring Effortless
- Distributed tracing
- Error analytics
- Custom dashboards
How APM Reduces Downtime and Improves Application Performance
Spot bottlenecks instantly before users notice them.
Setting Up New Relic APM for Your Application
Creating and Configuring Your New Relic Account
Sign up at newrelic.com, pick your stack, and grab your license key.
Installing the New Relic Agent for Your Tech Stack
- Run
npm install newrelic(Node.js) or use your language-specific agent
Connecting Your Application to the New Relic Dashboard
Add your license key to the config file, then restart your app.
Verifying a Successful Setup
Check the APM dashboard for incoming data within five minutes.
Navigating the New Relic APM Dashboard Effectively
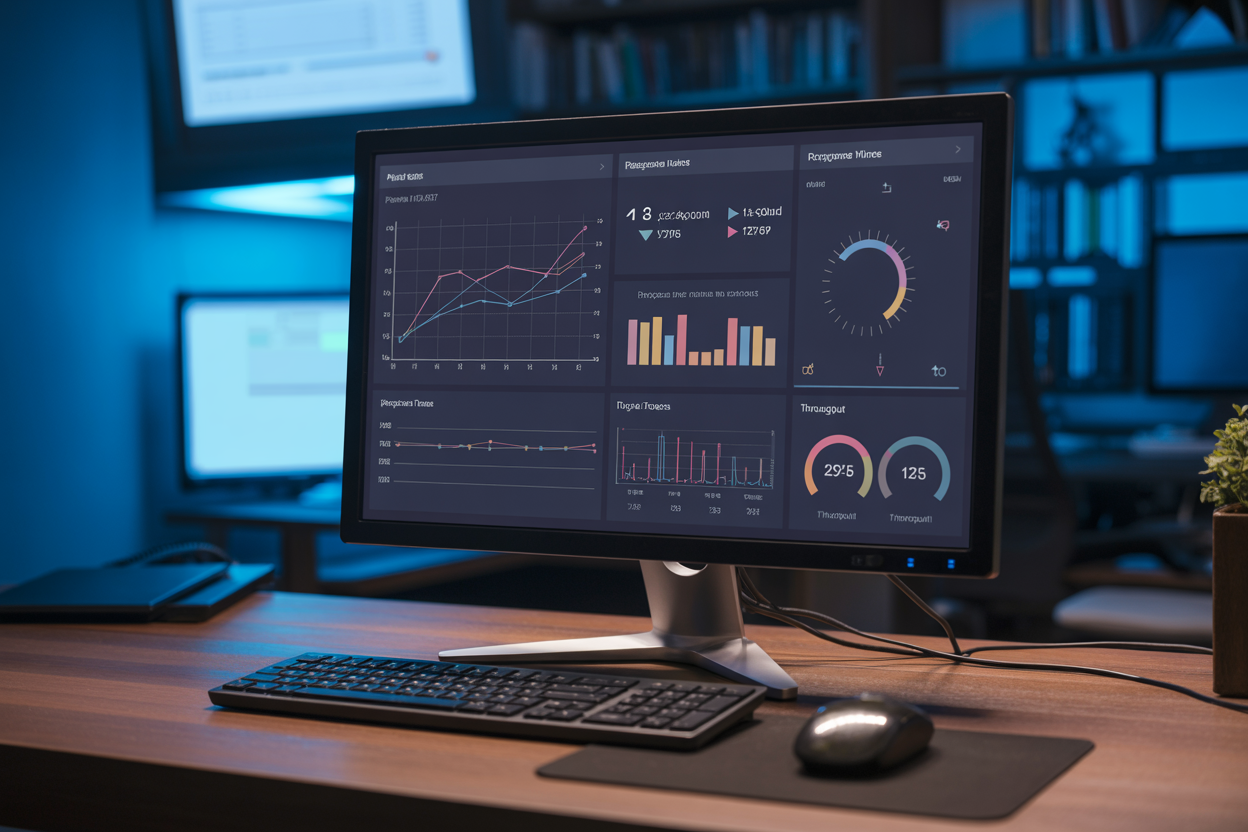
Understanding the Summary View and Key Performance Metrics
The Summary View shows response time, throughput, and error rate at a glance.
Using the Transactions Page to Identify Slow Endpoints
Sort by slowest average response time to catch bottlenecks fast.
Monitoring Error Rates and Pinpointing Root Causes
- Stack traces reveal exact failure points instantly
Setting Up Alerts to Catch Issues Before They Escalate
Defining Alert Policies Based on Critical Thresholds
Set thresholds for response time, error rates, and throughput in New Relic APM alerts.
Configuring Notification Channels for Instant Team Awareness
- Slack, email, PagerDuty integrations keep teams informed immediately.
Using Anomaly Detection to Spot Unusual Behavior Early
Catch unexpected spikes before users notice.
Testing Alerts to Ensure Reliable Incident Response
Run simulated violations regularly.
Tracking and Improving Application Performance Over Time
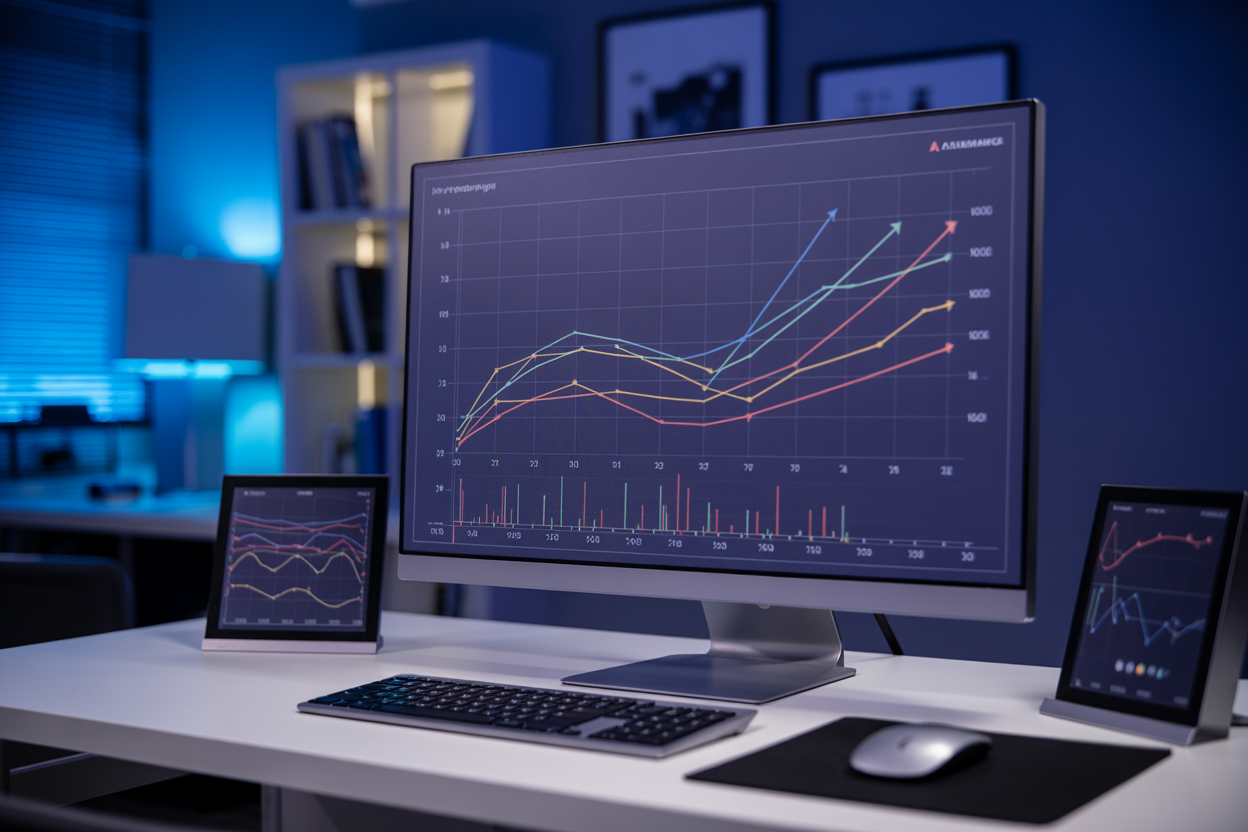
Using Custom Dashboards to Monitor Business-Critical Metrics
Track revenue-impacting transactions, error rates, and throughput using New Relic’s drag-and-drop dashboard builder.
Analyzing Historical Trends to Forecast and Prevent Bottlenecks
Spot recurring slowdowns before they hit users by reviewing week-over-week performance data.
Leveraging Distributed Tracing for Deep Performance Insights
- Pinpoint slow database calls
- Identify failing microservices instantly
Integrating New Relic APM into Your DevOps Workflow
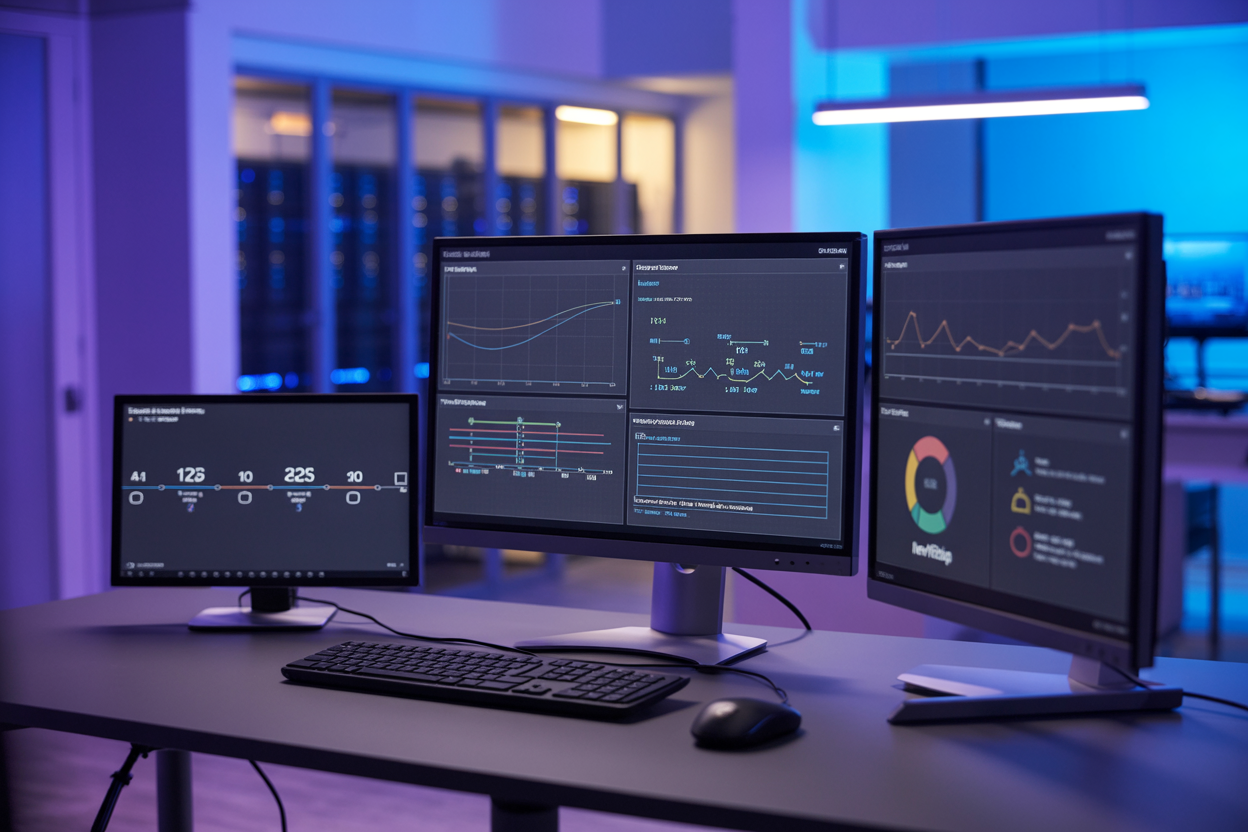
Connecting New Relic with CI/CD Pipelines for Continuous Visibility
Plug New Relic into Jenkins, GitHub Actions, or GitLab CI to track deployments alongside performance data automatically.
Collaborating Across Teams Using Shared Dashboards and Reports
Share custom dashboards with dev, ops, and business teams for aligned visibility.
Automating Remediation Actions Based on Alert Triggers
- Auto-scale servers
- Restart failed services
- Trigger runbooks via PagerDuty or Slack webhooks
Measuring the ROI of Proactive Production Monitoring
Reduced downtime directly cuts revenue loss, making DevOps monitoring integration a measurable business win.
Getting production monitoring right can feel overwhelming at first, but New Relic APM makes it manageable. From setting up your first dashboard to building alerts that actually catch problems early, the steps covered here give you a solid foundation to keep your application running smoothly. The real power comes from weaving it into your everyday DevOps workflow, so monitoring becomes second nature rather than an afterthought.
Start small if you need to — pick one or two key metrics, set up a few alerts, and get comfortable with the dashboard. Once you see how quickly you can spot and fix issues, you’ll naturally want to dig deeper. The goal is not just to react to problems but to stay ahead of them, and New Relic APM gives you the tools to do exactly that.
The post Production Monitoring with New Relic APM: A Step-by-Step Guide first appeared on Business Compass LLC.
from Business Compass LLC https://ift.tt/SYycGmZ
via IFTTT


Comments
Post a Comment